Grafana Dashboard
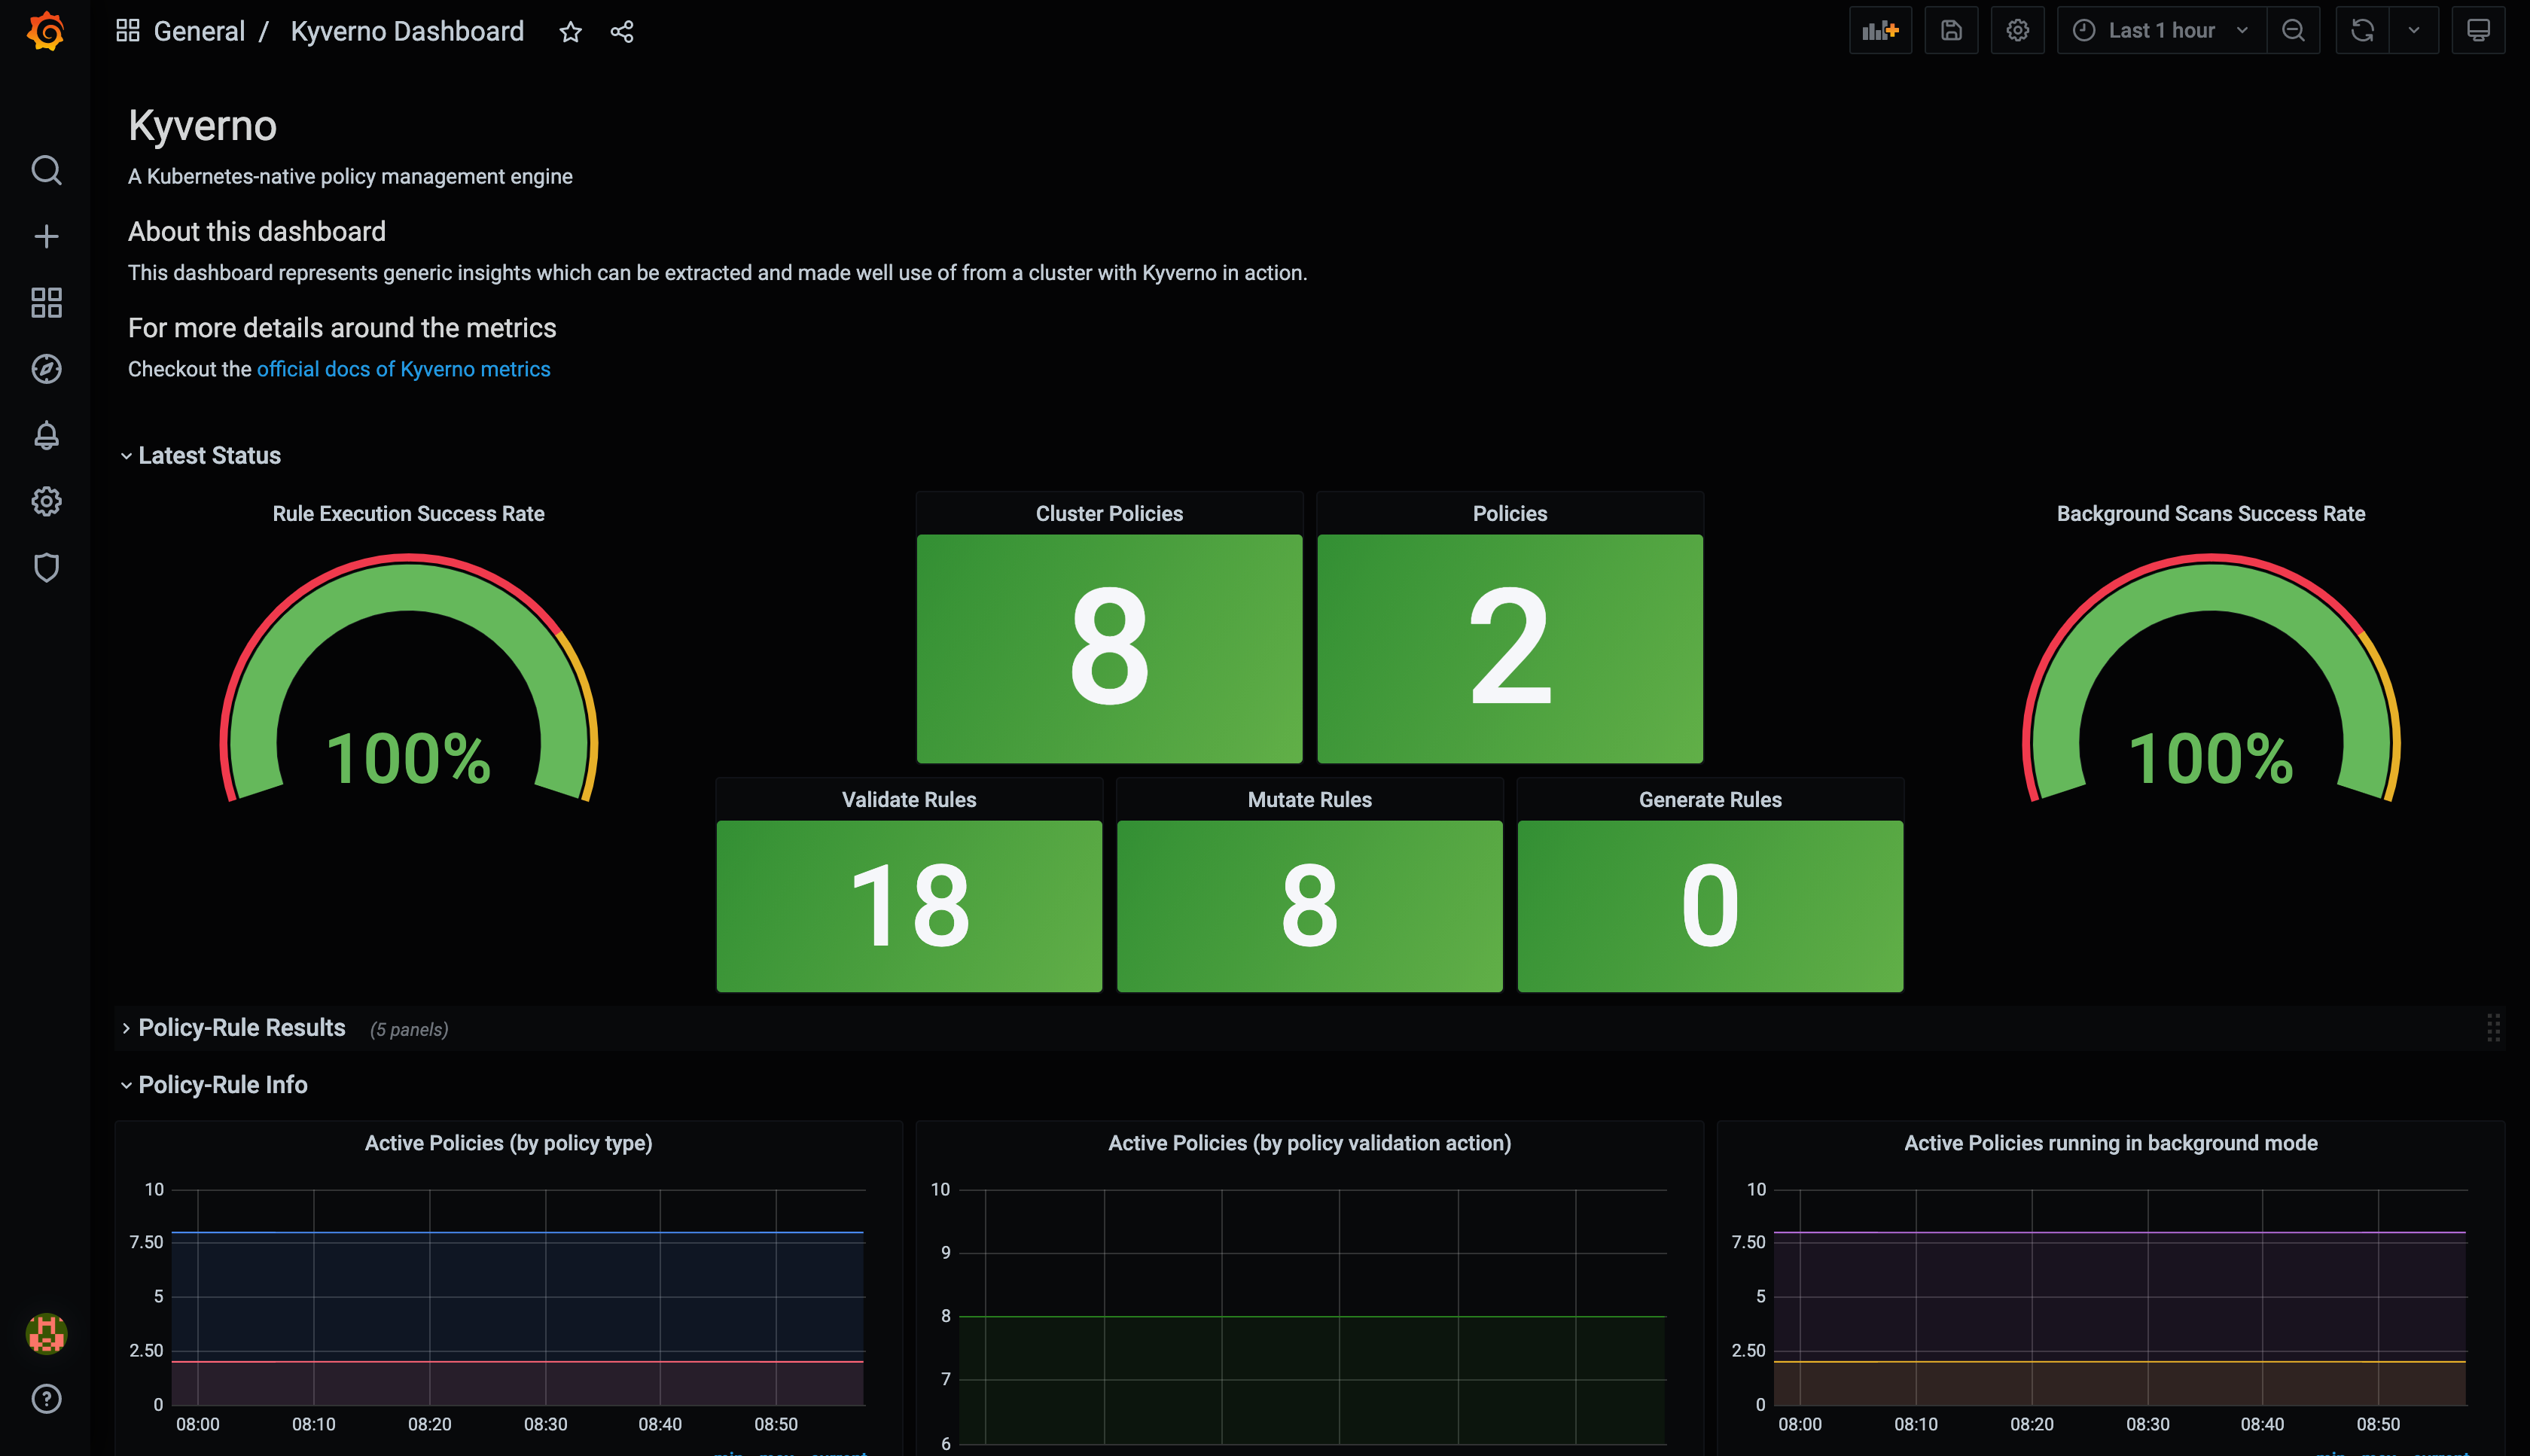
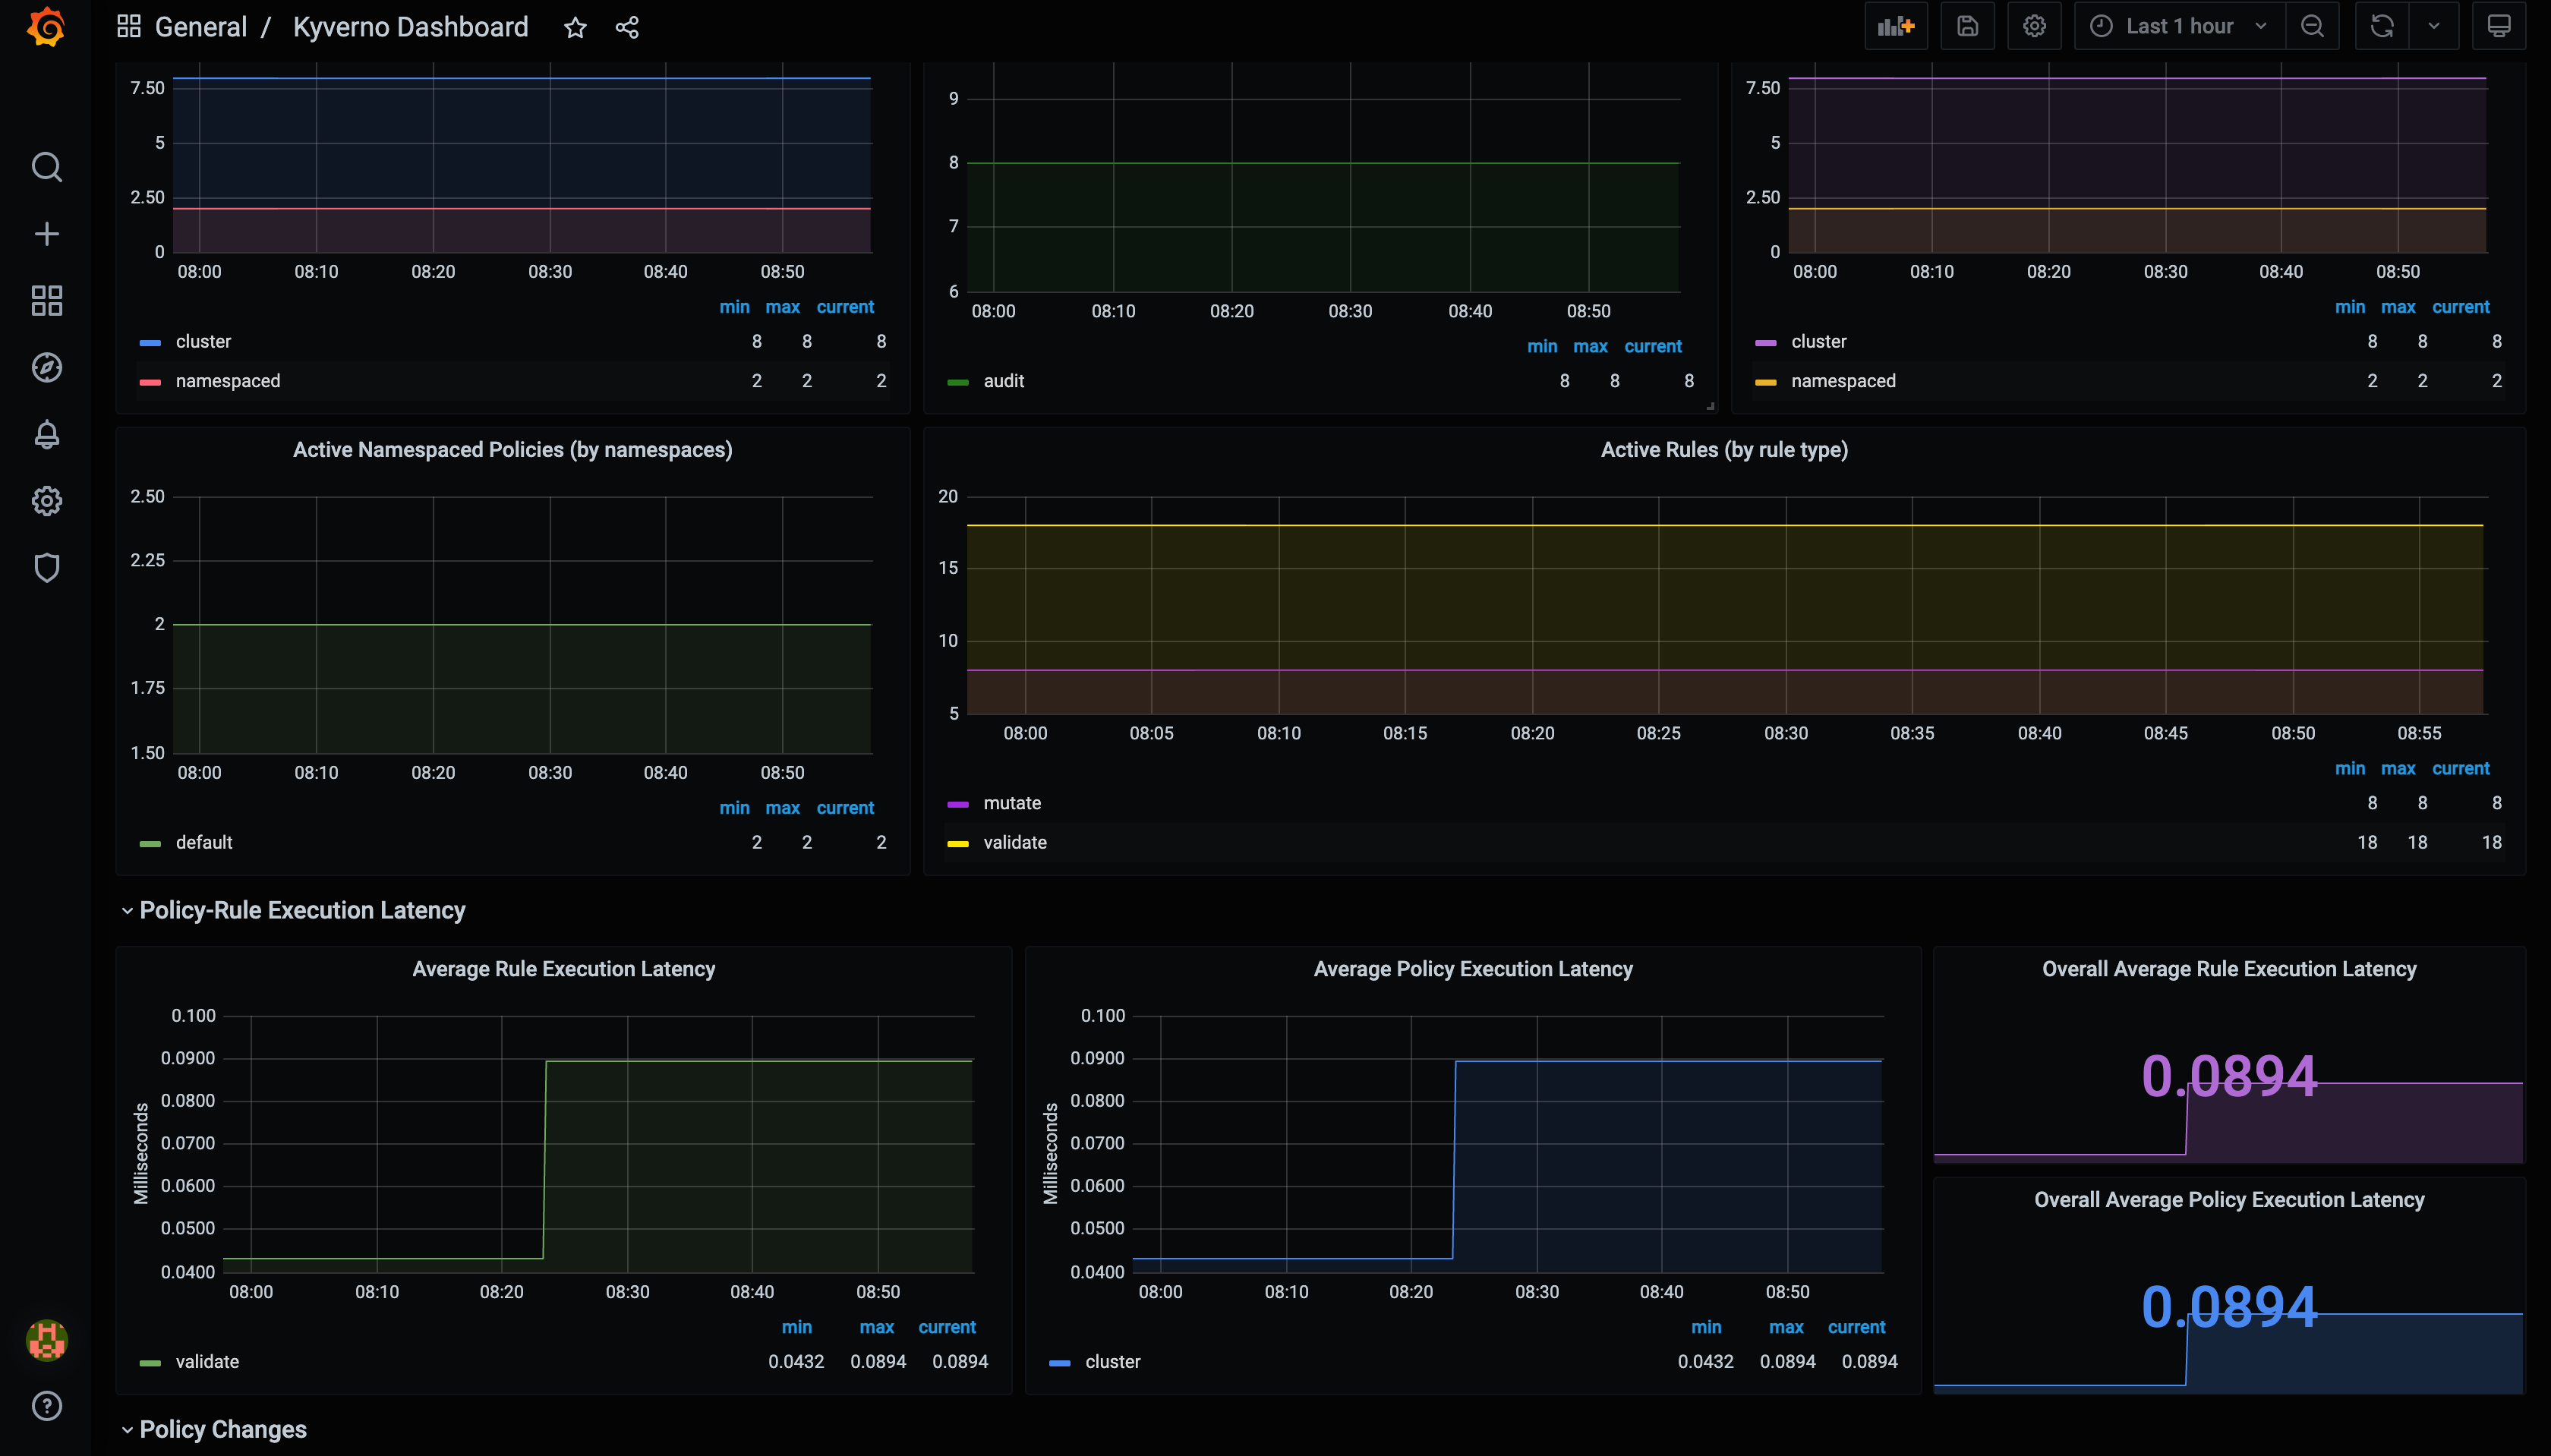
A ready-to-use dashboard for Kyverno metrics.
Grafana Dashboard
Setup
With Helm Chart
- If your Grafana is configured with the discovery sidecar, set
grafana.enabledvalue totrue. - If you’re using Grafana Operator, set
grafana.enabledtotrueandgrafana.grafanaDashboard.enabledvalue totrue.
See more configuration options here.
Without Helm Chart
- Download the dashboard’s JSON and save it in
kyverno-dashboard.json
1curl -fsS https://raw.githubusercontent.com/kyverno/kyverno/main/charts/kyverno/charts/grafana/dashboard/kyverno-dashboard.json -o kyverno-dashboard.json
Open your Grafana portal and go to the option of importing a dashboard.
Go to the “Upload JSON file” button, select the
kyverno-dashboard.jsonwhich you got in the first step and click on Import.Configure the fields according to your preferences and click on Import.
And your dashboard will be ready in front of you.


Feedback
Was this page helpful?
Glad to hear it! Please tell us how we can improve.
Sorry to hear that. Please tell us how we can improve.
Last modified December 01, 2023 at 1:22 PM PST: docs: update Grafana Dashboard page (#1019) (bd7a2af)